Canalblog
Suivre ce blog Administration + Créer mon blog

Finance, markets and success

27 décembre 2013

Market fundamental news (December 27th 2013)

This week shows a very positive sentiment. Indeed, we are witnessing a real Year-end rally in the markets. The CAC 40 closed at 4277.65 points increasing by 1.40%.

In the stock market, Alcatel-Lucent closed the trading day in the first place among the french index, with an incease of 5.97% at 3.30€. After its come back in the CAC 40, this stock under-performed its market and was in trouble. Today is most likely a short buy-back.

In the forex market, the EUR-USD currency pair soared to alsmost 1.3900$ which is a record level since 2011. This skyrocket is probably due to the declaration of the president of the Bundeskbank (Jens Weidmann) about its vigilence concerning the inflation. Or everyone is worried about the deflation.

In the fixed income market, the 10-year US bond approach the 3% at 2.872. The New Home Sales were better than expected (464K rather than 445K) and the Initial Jobless Claims also (338K rather than 345K). The investors think more and more of a normalization of the market, notably with the tapering of the Federal Reserve (already $10M less in the quantitative easing).

Globally, the end of this year is extremely positive, taking into account the analysts' forecasts in the beginning of the year. The US indices are at their all time high. The DAX continues to outperform other European indices.

The reasons are justified to be very optimistic for 2014. Many companies are to recover their results and the consumption of households (notably in the US) shows a certain confidence in the future.

Publicité
Publicité
26 décembre 2013

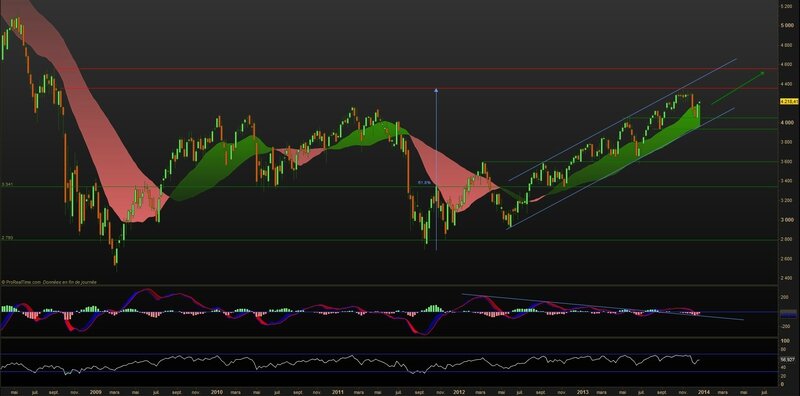
CAC 40 (December 26th 2013)

CAC 40


In this daily candlesticks chart of the french index CAC 40, we can set up a bullish scenario.

The index follows a bullish trend since the beginning of June 2013, notably in an uptrend channel. The price was able to overcome its latest top above the 3341 points support, which is corresponding to the 61.8% of Fibonacci retracements.

Lately, the price was not able to break below the 4050 points support, level where it possible to observe a polarity (phenomenon where former resistance (support) turns into support (resistance)). If we have a polarity, we have a trend (here bullish).

The MACD indicator shows a former descending resistance turning into support. The MACD has just made a bounce in this new dynamic support, which is giving impetus to the bullish movement. As for the RSI indicator, we are not in the overbought or oversold area.

Ultimately :

- If you are already Long (bullish) CAC 40, you may keep the position.

- If you are not, you may initiate a Long position now with an objective at 4558 points and an invalidation level at 4050 points).

- If you are short (bearish), we hope your stop-loss is not far away.


25 décembre 2013

CREDIT AGRICOLE (December 25th 2013)

Crédit Agricole


In this daily candlesticks chart of the french stock "Credit Agricole", we can set up a bullish scenario.

First of all, we can see a bullish trend (uptrend channel) since the end of July 2012. The crests and troughs are still higher. Further more, the opening of a bullish gap last week strengthen this trend.

More recenly, it is possible to discuss on the fact that the price fails to breakout the 9.50€ resistance. But the troughs continue to increase aboce the 8,75€ support, corresponding to the 23.6% of Fibonacci retracement (blue arrow). The opening of the bullish gap enabled the price to breakout the 20-periods and 50-periods movering averages, which are still rising.

The MACD indicator is to cross its signal line in the rise. As for the RSI indicator, there is no sign tension in the price.

To conclude, those who already "Credit Agricole" in portfolio sould keep it. Those who don't should think of the possibility to take position at the breakout of the 9.50€ resistance, or near the 8.75€ support (after a short of the price).


25 décembre 2013

Welcome to my blog

Welcome,

This blog is aimed to give to all interested persons the necessary keys to intervene in the markets. Obviously, as I don't have direct relation with you, I can't take into account your profile of investor. Consequently, you may invest taking into account your horizon of trading (intraday, swing, short-term, long-term...) and you personal resources (size of each postion entered in the markets).

In this blog, each recommandation will be attached with a candlesticks chart. If you want me to analyze a stock in particular, please feel free to leave a comment.

Now a very important point: I will issue recommendations to buy or sell such and such stock (or another asset class), but you are free to follow it or not. As a consequence, I WILL NOT BE RESPONSIBLE FOR ANY OPERATION YOU INITIATE IN THE MARKETS. These recommandations are aimed to describe how I interpret the markets, not enticing you to make a trade.

Having said that, I wish you success in the markets, and remember, risk is part of our life. We just have to minimize it.

Good luck !

Publicité
Publicité
Finance, markets and success
Publicité
Pages
Archives
Newsletter
Publicité